In October of 2017, we performed a year-on-year analysis of Intellectual Property (IP) licensing transactions. The following article replicates the analysis to include all updated information within our database of over 120,000 agreements and 65,000 royalty rates. All data has been normalized so that trends can be highlighted.
Royalty Payment Agreement Bases
Royalty payments are always connected with a base of measurement on which the payments are calculated. Net and Gross Sales are the two bases most frequently used for royalty payments, and the data we’ve aggregated from the last ten years reflects this observation. Net and Gross Sales benefit the licensor because they are reflective of completed sales that have fulfilled the agreement’s purpose. On the other hand, royalty payment agreements based on profit, for example, are complicated by other factors and costs. While agreements with royalty rates based on sales still remain high, alternate forms of royalty rate payment bases can still be seen. Royalty rates based on Net and Gross Profits have declined throughout the last ten years, but royalty calculations made on Costs saw a slight resurgence in 2016. We also observe that those agreements taking assets or operating profits into account have greatly decreased since 2014.
The chart below takes a closer look at Net Sales, the most frequently used base. Notice that the average annual royalty rate peaked in 2010 at almost 15% before bottoming out in 2014 at nearly 9%. Since then the annual royalty rate has climbed steadily and sits at 13.2% for 2016. The decrease in 2017 is to be expected as agreement data collection often lags behind a year. Given the average Net Sales, royalty rate has increased in the last two year, the 10.2% royalty rate can be expected to increase as more data is added to the database. This upward trend may indicate a recovery in asset valuation, perhaps attracting more assets into the market and foreshadowing more lucrative transactions.
Which Industries Are Transacting?
According to our royalty rate database, it appears that the bulk of our transactions come from only a handful of the 38 industries we have identified. In 2007, the top five industries accounted for 46% of all transactions, whereas in 2016, they accounted for over 62%. Most industries appear to have weathered the effects of the Great Recession between 2007 and 2009, and some, such as Biotechnology and Pharmaceuticals, have seen dramatic increases in activity. Alternatively, the Consumer Services industry has declined significantly since 2015, not even breaking the top five industries transacting in the last two years.
Top Transacting Industries 2008-2017
Source: ktMINE database of over 120,000 agreements and 65,000 royalty rates.
What Types of Agreements Are Transacting?
As to be expected given our vast repository of IP license agreements, Manufacturing/Process Intangibles and Marketing Intangibles consistently see the most agreement activity. These agreement types cover patent, trademark, know-how, and other such IP related to the making and selling of products. Beginning in 2015, Marketing Intangibles, in particular, have seemed to recover from a five-year lull between 2010 and 2014. This might be related to an uptick in Mergers & Acquisitions activities, perhaps indicating an increase in brand turnover or brand management. Agreement types in the Software, Service, and Joint Development categories have seen intermittent activity since 2015, perhaps related to the industries transacting in the IP space.
Agreement Types from 2007-2017
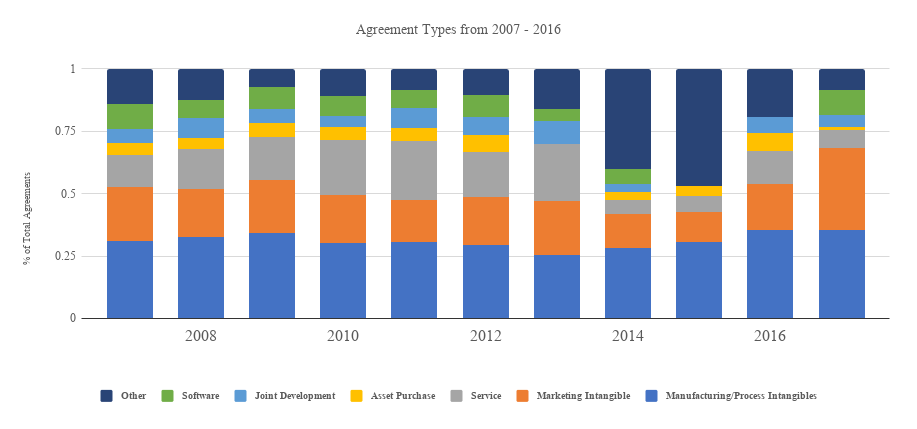
Source: ktMINE database of over 120,000 agreements and 65,000 royalty rates.
Conclusions
Based on our agreement and royalty rate data, over the past ten years:
- Royalty rate bases have fluctuated in diversity. Net and Gross Sales remain the most popular bases on which to calculate payments, but 2016 saw an increase in royalty rates based on Net and Gross Profit. This may indicate that companies have become more confident in their prospects and are therefore being more creative with their engagements.
- Legacy industries like consumer goods and services are giving way to pharma and biotech. This consolidation in the number of transacting industries may broadly suggest that the marketplace is evolving to favor healthcare-related technologies.
- All agreement types appear to be recovering from a dip in 2015. Joint Developments, in particular, have made a comeback in the last two years, potentially related to collaborations between entities operating in the pharma and biotech industries.