Since our inception in 2008, we at ktMINE have collected an abundance of data related to intellectual property (IP) and IP licensing transactions in various technologies. This includes royalty rates, agreement types, applicable locations, and industries that are transacting. Even though the data that we aggregate can vary, a year-on-year review of the data reveals interesting insights. Below, we’ve normalized the data so that the prevailing trends shine through.
Royalty Payment Agreement Bases
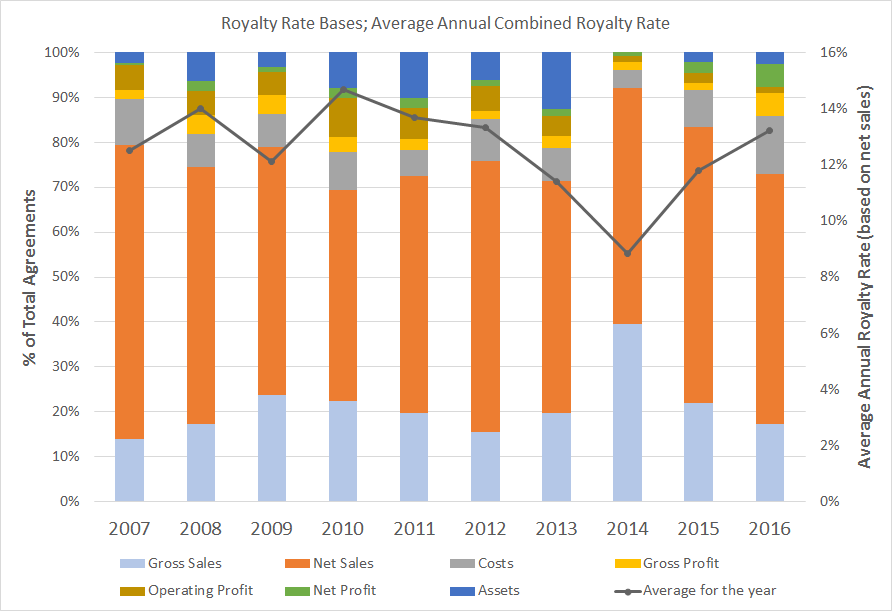
Almost as a rule, royalty payment agreements are written as a percentage of sales, either Net or Gross. A completed sale ensures the fulfillment of the agreement. On the other hand, royalty payment agreements based on profit are complicated by other factors and costs. While agreements with royalty rates based on sales still remain high, alternate forms of royalty rate payment bases have increased in volume since 2015. Royalty rates based on Net Profits, Gross Profits, and especially Costs have become more prevalent. We also observe that those agreements taking assets or operating profits into account have tapered off in recent years.
The chart below takes a closer look at Net Sales, the most widely-used base. Notice that the average annual royalty rate peaked in 2010 at just over 15%, before bottoming out in 2014 at nearly 9%. Since then, the annual royalty rate has climbed steadily and sits at 13.2% for 2016. This upward trend may indicate a recovery in asset valuation, perhaps attracting more assets into the market and foreshadowing more transactions.

Contact ktMINE for a demo to see updated product details and functionality
Which Industries Are Transacting?
According to our royalty rate database, the bulk of transactions are occurring in a handful of industries. In 2007, the top five industries accounted for 46% of all transactions, whereas in 2016, they accounted for 55% of the total. Most industries appear to have weathered the effects of the Great Recession between 2007 and 2009. However some, like Biotechnology and Pharmaceuticals, are on a dramatic incline. Alternatively, industries like Consumer Services and Business Services are either trending downward or are stagnating.
Contact ktMINE for a demo to see updated product details and functionality
What Types of Agreements Are Transacting?
In keeping with the diminishing activity in Consumer Services and Business Services industries, the percentage of service agreement types is also dropping. Software, Joint Development, and Asset Purchase agreements have seen intermittent activity since 2013. We also observe a steady uptick in Manufacturing/Process Intangibles agreement types. The recent recovery of Marketing Intangibles might be related to an uptick in Mergers & Acquisitions activities, perhaps indicating an increase in brand turnover or brand management.
Contact ktMINE for a demo to see updated product details and functionality
Royalty Rate Data Conclusions
Based on our royalty rate data, over the past 10 years:
- Royalty rate bases have become much more diverse, indicating perhaps that entities have become more confident with their prospects and are therefore being more creative with their engagements.
- Legacy industries like consumer electronics and services are giving way to pharma and biotech. This consolidation in the number of transacting industries may broadly suggest that a marketplace evolution is underway.
- All agreement types appear to be recovering from the 2014/2015 dip with the exception of software, which may also indicate a shift in the marketplace.
Check back quarterly for further insights on these and additional data points found in our royalty rate database.