This is the final installment in our series highlighting the different areas to investigate in an effort to strengthen your company’s IP research strategy. In parts one, two, three, and four we covered the importance of analyzing emerging technologies transacted and licensed technologies as well as emerging brands. In this post, we discuss how analyzing who is participating in the market can play a role in the success of your company’s strategy.
Market participants in a given industry, technology, or region can provide insights into the breadth of activity. They can also help identify key competitors. If we take a look at artificial intelligence (AI) and the intellectual property of those involved, we will be able to identify partners, licensors, competitors, and others that represent potential engagement parties.
Artificial Intelligence: Agreements
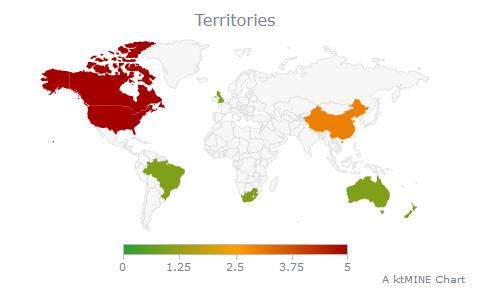
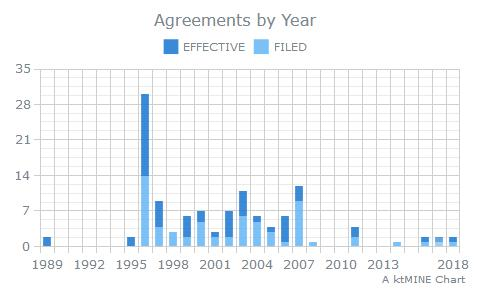
On the surface, just observing the number of agreements involving AI can highlight whether a particular technology is transacting. Analyzing the chart on top, we see AI agreements as far back as the 1990s, with activity tailing off in the mid-2000s, before picking up again only more recently. The map on the bottom tells us that this activity is weighted primarily in the United States, followed by China, and then a handful of other countries.
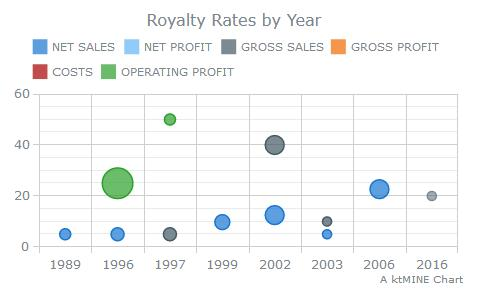
If you take a look at royalty rate data, you see that it echoes the activity with a transaction gap between 2006 and 2016. The gap may be explained by the need to allow for adjacent technologies to mature. It might be too soon to say that the value of AI technology is increasing as it “ages”, but it is higher.
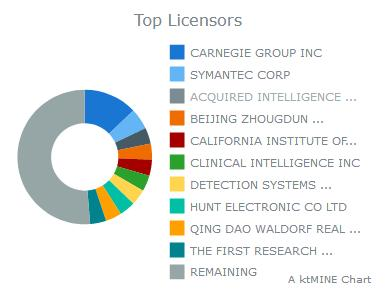
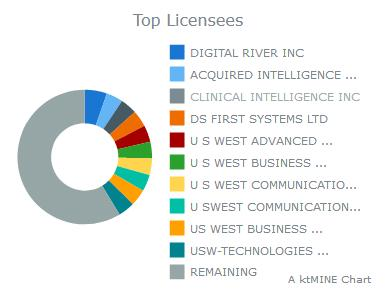
The above charts highlight the entities transacting – from Carnegie Group, Symantec, and others licensing out, to Digital River and Acquired Intelligence licensing in. Knowing players on both sides of a transaction gives significant hints on which industries and sectors are positioning for future growth. It answers the question of who is acquiring, divesting, licensing in or out.
Artificial Intelligence: Patents
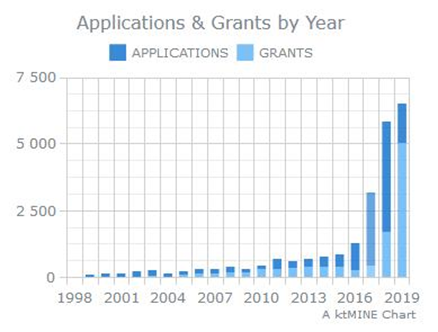
Pulling the above graph from the ktMINE Patent Application, we observe a noticeable trend – an increase in patent activity in 2016, and an explosion thereafter. It is interesting to note the applications in 2017 and 2018 versus the increase in grants in 2019.
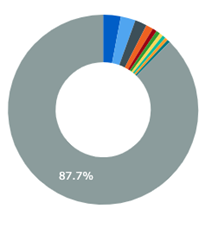
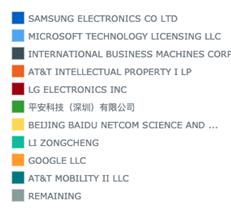
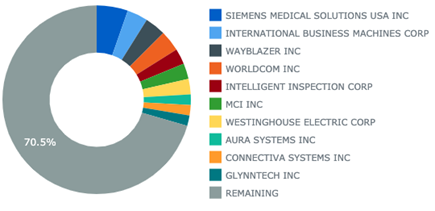
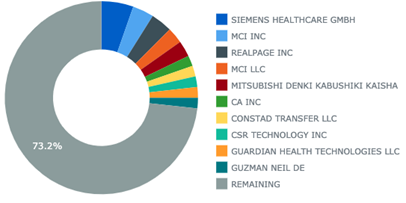
From the above pie chart, we can see that the top ten entities hold roughly 12% of all granted patents worldwide, but if we consider carefully the entities and the sizes of their portfolios, we are able to distill out some actionable insights from a more granular view.
For example, large portfolio holders can be licensees, licensors, assertion candidates, sellers, or buyers. Those in the middle can be considered for a joint venture or a formal partnership. Small portfolio holders could be sellers, buyers, or M&A candidates. All of this enables a portfolio manager to contemplate “competitors” and strategies. Having access to this data provides more power behind IP assets that are owned, aiding with the development of plans to address IP gaps.
Artificial Intelligence: Agreements
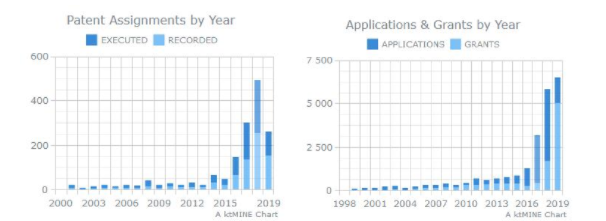 Patent assignments are also important in gaining insights. Again, not every entity is able to develop technology organically, and because not all transactions are formally published, assignment cover sheets can fill the gap by informing when assets are moving as well as which assets are moving. In the above graphs, the chart on the left shows that AI assignments ticked up notably in 2014, whereas the chart on the right shows only gradual increases in patent applications and grants. Could assignments be an interesting indicator of what is to come?
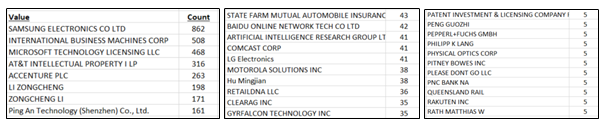
Knowing who is involved with assignments is also helpful since it provides another indicator of technology engagements. You can use different datasets to vector in on conclusions more effectively. Here, the chart on the left shows the top entities that are assigning patent assets out while the chart on the right shows entities receiving assets. Which entity has enough assets to confidently transact? In the case of Siemens, the assignment information in the two charts can also show if an entity is changing its organizational structure.
A quick summary of the other segments:
- The Blockchain segment showed how you and your competition may be reacting to disruptive technology.
- The Packaging segment (Amcor/Bemis) indicated that if you don’t have the tech, you can acquire it from someone who does.
- The Bellicum/Leiden segment showed how you can access technology via licensing.
- The Volkswagen segment showed how brands can foster the progress of your strategy.
Next Steps:
Now that you have all of this information: the technologies that are transacting, the agreement information showing engagement trends and royalty rates, the entities that are licensing or assigning assets out or in, and the assets themselves. Now what?
You can use this information to sharpen the execution of your strategy. For example, a look at technology can help determine alignment and relevance. An understanding of transactions and licenses can indicate a level of activity. Brands and Marks provide another perspective, another place to look. And knowing those that are active in a particular space will help determine the level of competitive threat.
Your analysis might look something like this:
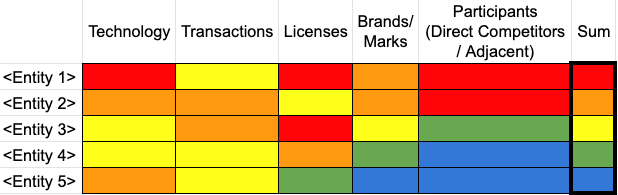
Having this information can help better connect your IP to your business (and benefit both) as you explore new options.
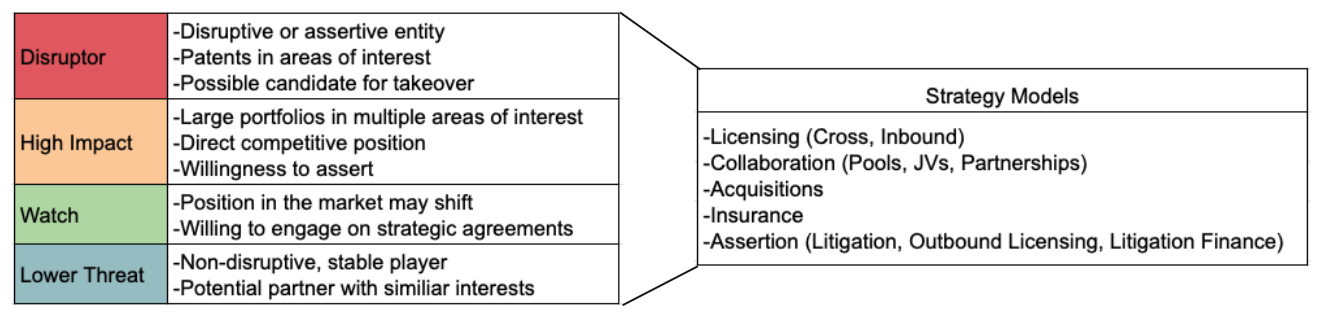
Since each engagement is unique, any of these options or perhaps a combination may be used.
Strengthening your IP position is about turning IP into a more proactive resource that can enable a business strategy, and exercising your IP assets in a way that supports your business goals. If you would like to discuss further ways to leverage IP data to strengthen your company’s business model please don’t hesitate to reach out to us at info@ktmine.com.