Just as a quick review, in part one, we examined overall U.S. applications and grants for the first half of 2018, 2019, and 2020. We looked at the top technology areas and observed how some have surged and some have receded. In part two, we pivoted towards the top applicants and how that list has changed over the course of the past few years.
Industries
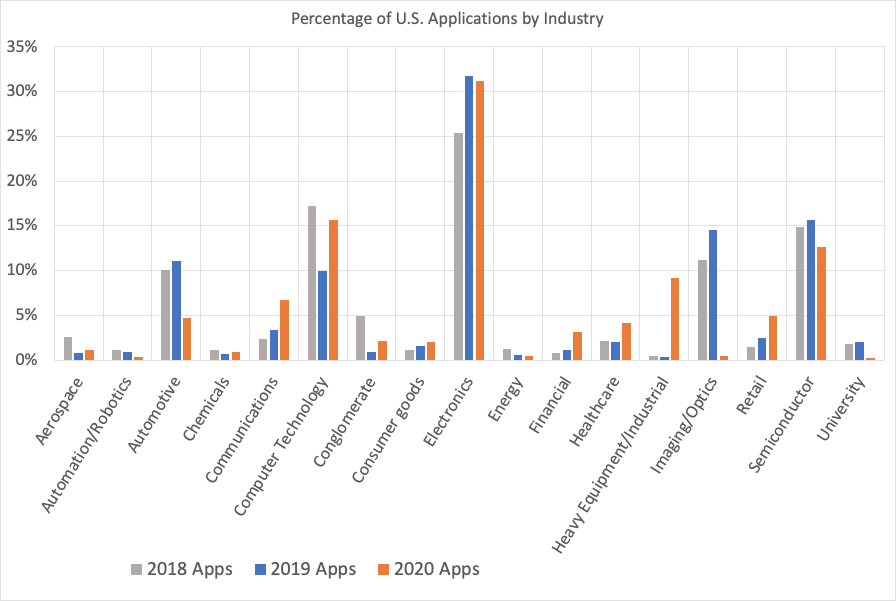
Finally, let’s look at how the data cut across industries might provide insights.
Applications:
For U.S. applications, there are certain noticeable observations. For example, for 2020, filings in the Aerospace, Automotive, Energy, and University sectors have declined. These might be easily explained by the current suppression of travel and large gatherings. Filings for sectors like Computer Technology, Electronics, and Semiconductors appear to be minimally impacted. Sectors like Communications, Retail, and Healthcare appear to be finding opportunities in the mayhem. Some may have more complicated situations, like the Heavy Equipment/Industrial or Financial sectors. These can be picked apart more using other data sources, but it is clear that the application filings are telling a story.
Chart 1: Percentage of U.S. Applications filed by Industry
Patents:
For patents, we notice that the Consumer Goods, Healthcare, and Retail sectors have done comparatively well in the first half of 2020. As with applications, patents in the Healthcare sector are easily explained. But what about patents in the Consumer Goods sector? Well, upon digging a little deeper, many of these patents are design patents for consumer products. These may not require the same rigor during examination that utility filings require, so it may be that the less demanding applications are more readily prosecuted.
Unlike with applications, patent grants for the Computer Technology, Electronics, and Semiconductor sectors have dipped. It may be that these innovations are technologically complex requiring intensive examination and the necessary resources may not be available to properly prosecute them. It may also be a strategic decision to hold off on costly prosecution given the current economic turmoil. Additionally, companies may need resources for more immediate and tactical expenditures.
Chart 2: Percentage of U.S. Patents filed by Industry
source: USPTO patent and application data via ktMINE
So there you have it, U.S. applications and grants for the first half of 2020 and through the filter of technology, applicants, and industries. Even though patents and applications are closely related datasets, the difference in the resources required to submit a filing and work an application into a grant is telling. The funding and time required at each stage are impactful on business. The processing of both applications and grants are powerful levers and when exercised can translate into a desired result or outcome. We will continue to monitor these trends and check back in later in the year to see how the data reflects the unfolding events.