If your first question is, “What exactly is backtesting?” let’s dive in. Backtesting is a way to prove if adding a new dataset will positively or negatively affect a decision-making process. Does it have a delayed effect? How long is the delay? What are the tolerances between the different dates or timelines of the particular record of data?
These questions led to powered the ktMINE team to build a backtesting dataset. With access to ktMINE’s IP Solutions, we built a trading strategy to see if we could outperform the S&P 500. With our IP evaluation methodologies and value-added data points, we created a buy trigger putting it through several different backtests. What was the outcome of our internal backtesting? The results are nothing short of fascinating.
High-level performance
The chart below represents a stock that had a buy trigger using our IP evaluation backtest model. The buy trigger was 11/25/2019 at 60.86 held for 24 calendar days before it hit the target trigger at 70.26, producing a gain of 15.4%.
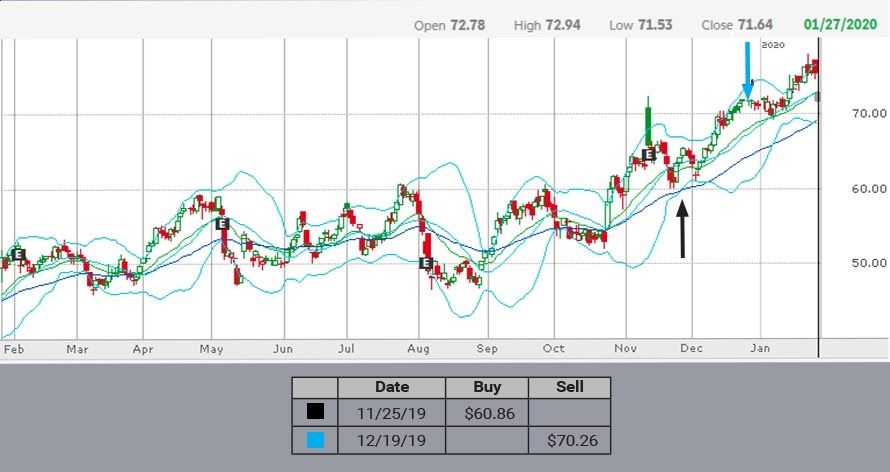
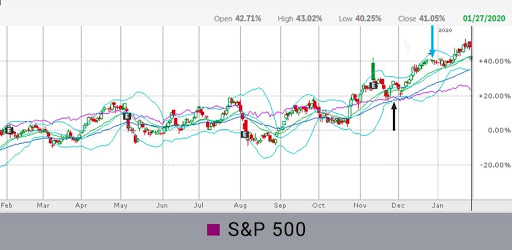
The immediate question that comes to mind is whether it performed at the market level, during that same period of time. So we benchmarked it against the S&P 500 and shortly after that is where it diverged significantly off the S&P 500. See below for the same chart with the S&P 500 overlay.
S&P 500 Overlay
This is great for a stock that’s trending higher, how about a stock that’s not trending higher? How can you take advantage of either a volatile stock or one that’s not necessarily trending in any direction?
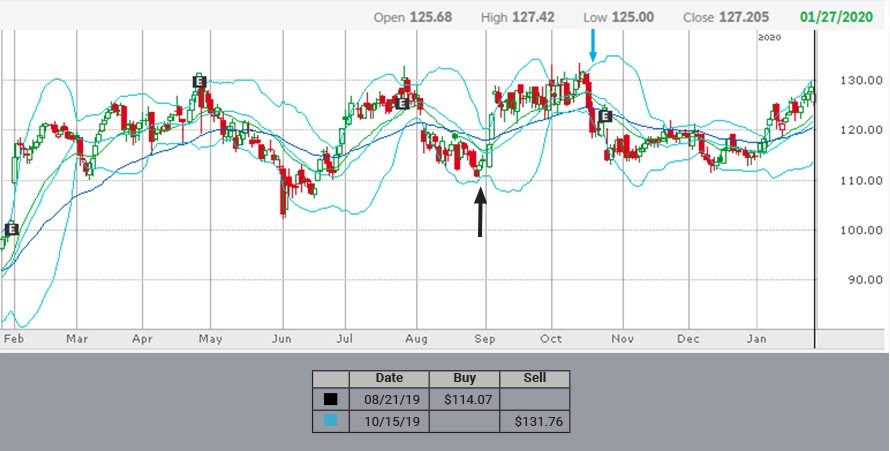
Below is another stock that had a buy trigger on 8/21/2019 at 114.07 held for 55 days before it hit the target trigger at 131.76, producing a gain of 15.5%. The first chart is its price movement the second is in comparison to the S&P 500. You’ll notice that the trend of the stock is pretty flat with volatility ranging between +10% and +30%. The goal is to find effective trigger points with this stock.
S&P 500 Overlay
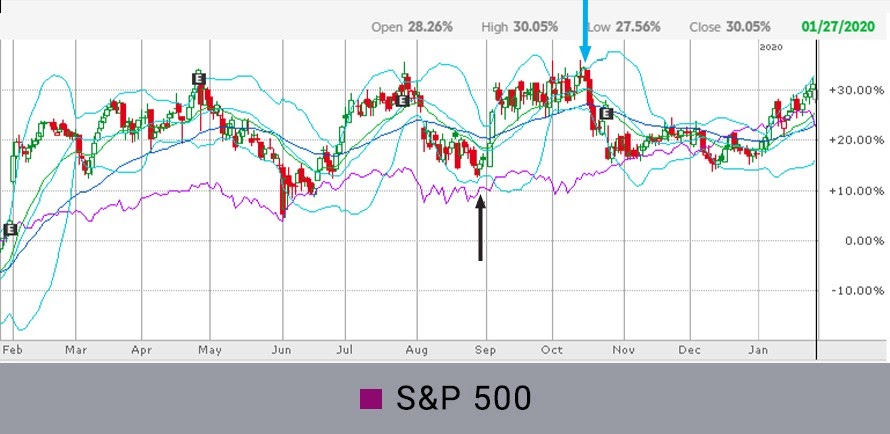
The two previous charts show a lot of volatility and no significant momentum in any direction. However, using a solid buy trigger based on IP data we were able to exploit an opportunity that may not have been otherwise obvious. Using metrics generated from the ktMINE IP data lead to a return in many different scenarios.
In order for a data provider such as ktMINE to show value and articulate how that value or alpha may be achieved – it is our responsibility to understand what the data means and how it could be leveraged to help generate alpha for our customers. If you’d like to learn more about our approach, methodologies, and how longer-term backtesting went be sure to reach out to the ktMINE team – we would love to chat.