With the first half of 2020 behind us, let’s review some patent and application data for perspective, comparing it with 2018 and 2019. Although the data for 2020 is incomplete due to data availability as well as limitations on what has been made public to date, there are still some insights and observations that can be uncovered.
U.S. Patents and Applications
If we take 2018 as a “typical” year, we see roughly 151,000 U.S. applications filed and 74,000 U.S. patents granted within the first six months, with the top applicants including IBM, Samsung, Canon, and other recognizable entities. Looking at 2019, we see a noticeable drop-off in the numbers with only 107,000 U.S. applications filed and 22,600 U.S. patents granted. These show a decline from 2018’s numbers by 29% and 69% respectively.
At this point, it might be admitted that these trends have already been recognized and explained (for example, see “America’s Innovators Need Clear Patent Laws” in the Wall Street Journal), with the declines attributed to any series or combination of events including an increased activity at international patent offices, 35 U.S.C §101 – Subject Matter Eligibility, recent and influential case law (i.e. Alice Corp. v. CLS Bank), and others. Because the time periods are the same year-on-year, and because the USPTO has been improving its examination rate, we may consider removing pendency as an explanation for any declines (USPTO Pendency updates).
Chart 1: U.S. Grants and Applications – January to June
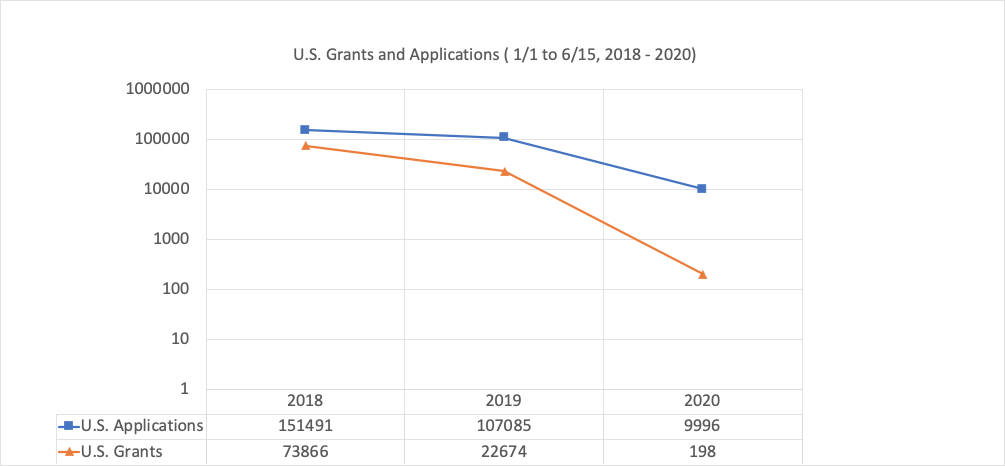
Source: USPTO patent and application data via ktMINE
If we tiptoe into 2020, then the wheels really fall off the cart. Only 9,996 U.S. applications filed and 198 patents granted. The 2020 numbers are orders of magnitude less than the previously reduced 2019 numbers.
Clearly, something is going on, and judging by Director Iancu’s address to Congress on June 11, the USPTO is fully aware of the impact of COVID-19 (USPTO). Moving forward here, we focus on percentages of the respective annual totals in an attempt to normalize past the actual numbers.
Technology Classifications
During the past decade or more, there are a few classifications that enjoyed high volume activity. These include technologies in electronics, wireless communications, semiconductor, and data processing.
Applications:
For applications filed, there is a consistent year-on-year pattern from 2018 to 2019 and into 2020, with 20% of the applications filed under CPC code G06F (Electric Digital Data Processing). A few of the top classifications show some variability, but outside of this and aside from overall volumes, there isn’t anything to suggest that the filings are operating under any unusual circumstances. Those technology areas that have been historically prevalent, continue to be the more active ones today.
Chart 2: Percentage of U.S. Applications, by Cooperative Patent Classifications
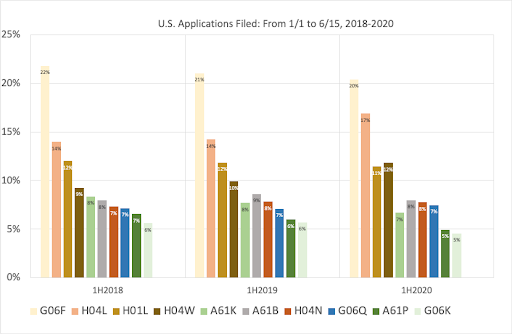
Source: USPTO patent and application data via ktMINE
Interestingly, the A61K (Preparations for Medical, Dental, or Toilet Purposes) and A61P (Specific Therapeutic Activity of Chemical Compounds or Medicinal Preparations) categories appear to experience a noticeable decline. This may be unexpected considering the recent focus on the Coronavirus / COVID-19 news, however, considering lengthy development timelines, these trends may still only represent pre-COVID activity.
Grants:
Looking at grants, there is some evidence of change. For the period 2018 to 2019, the technology areas for grants are reasonably consistent, with high volume classifications including:
G06F – Electric Digital Data Processing
H04L – Transmission of Digital Information
H01L – Semiconductor Devices, Electric Solid State Devices…
H04N – Pictorial Communication…
Chart 3: Percentage of U.S. Patents, by Cooperative Patent Classifications
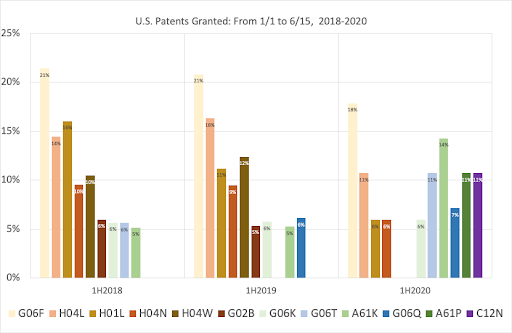
Source: USPTO patent and application data via ktMINE
But prevailing trends seem to unravel when we look at 2020 grants. Although the lead CPC codes remain active, different technology areas including A61K, A61P, and C12N (Microorganisms or Enzymes…) are rising up. Certainly considering the COVID news, it is not a stretch to presume an increased activity in bio- or health-related technology areas. However, because the number of grants so far for 2020 is incredibly small, the observed shift in the technologies pursued could have as much to do with the drop off of once-active classifications as with any increase in activity in any other classification. Also, high volume filers may be electing to control costs by pulling back on patent prosecution.
In part two, we’ll look at the top applicants of U.S. patents and see how the list has changed during the past few years.